Advice for Employers and Recruiters
Part 4: As the world interns: The impact of identity and social, economic, and cultural capital on college student internship engagement | Purpose Statement, Research Questions, Data Preparation & Hypotheses


This is the fourth of six articles in this series, click here to go to the first article. If you’re searching for a remote internship, go to our search results page that lists all of the remote internships and other entry-level jobs advertised on College Recruiter and then drill down as you wish by adding your desired category, location, company, or job type.
CHAPTER THREE: METHODOLOGY
I begin this chapter by reviewing the purpose statement and defining operational variables used in the current study. I then present the research design, which includes research questions, the hypotheses, and an examination of the National Survey of Student Engagement (NSSE) as a survey instrument. Subsequently, I offer a description of the institution where the study takes place and population I examined for this study. I then outline the research procedure and provide a data analysis plan.
3.1. Purpose Statement
The purpose of this study is to examine the differences in identities and cultural, social, and economic capital held by University of Vermont undergraduates who participate in internships compared to the identities and cultural, social, and economic capital of those who do not participate in internships. An additional purpose is to explore the relationship between internship engagement and participants’ identity and cultural, social, and economic capital indicators.
3.2. Study Constructs and Variables
I analyzed a number of variables in this study, and I grouped these independent variables into themes of identity and social, cultural, and economic capital from the theoretical framework presented in Chapter Two (visually depicted in Figure 1). As I will explain later in this chapter, I also used the identity and social, cultural, and economic capital themes to create four different regression analyses. I outline the definitions and operationalizations for each variable in Table 1 below.
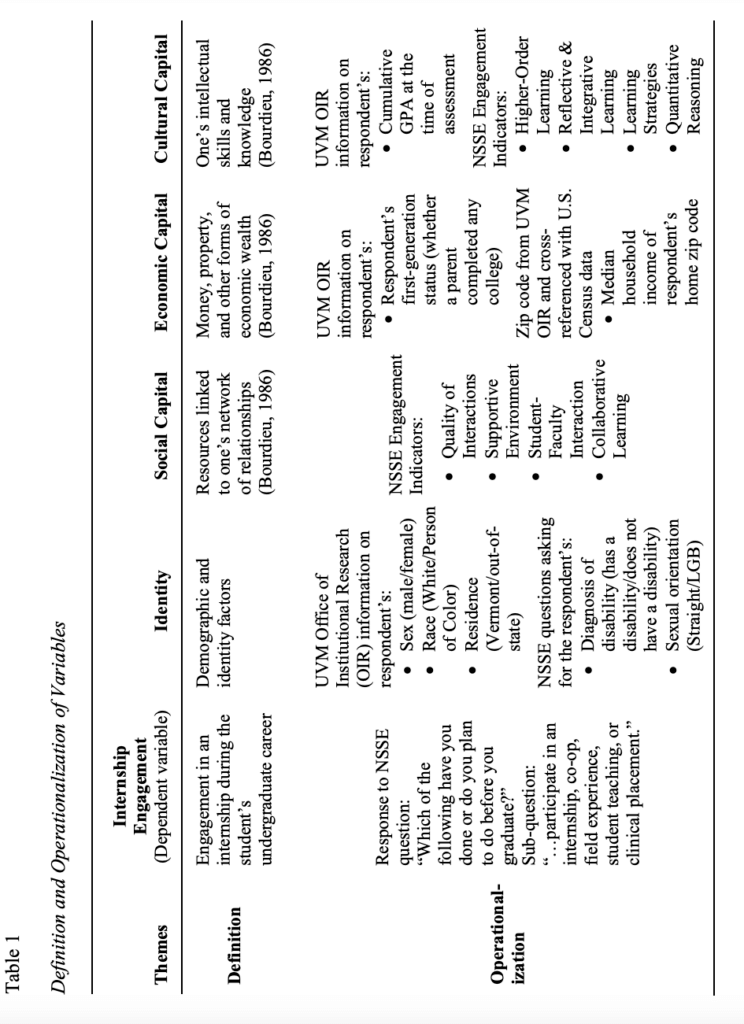
Internship participation: In this study, I defined an internship as work done in a professional environment; that has a connection from applied learning to academic/theoretical knowledge, offers experience that is valuable for the student, and this experience may in fact be more valuable for the student than for the employer. Internship participation is the dependent variable in the current study, and I measured it with a question asked in the National Survey of Student Engagement (NSSE). The NSSE
question that identifies internship experience is worded as, “Which of the following have you done or do you plan to do before you graduate?” The first sub-question is, “…participate in an internship, co-op, field experience, student teaching, or clinical placement.” Answer options are “Done or in progress,” “Plan to do,” “Do not plan to do,” and “Have not decided.” Because the current study examines participation and not intent, I only counted internship participation for those who answered that an internship was “Done or in progress.”
At the UVM student teaching and clinical placements are degree requirements for all majors within the College of Education and Social Services (CESS) and College of Nursing and Health Sciences (CNHS). Since this study examines elective participation, I excluded CESS and CNHS students from the dataset. UVM is currently piloting a co-op program in the College of Engineering and Mathematical Sciences, but fewer than 10 students a year participate in the program (L. Petrie, personal communication, September
6, 2018), and the work still satisfies the definition of an internship as is presented in the current study (UVM College of Engineering and Mathematical Sciences, 2018). The term “field experience” is often used in teacher education programs (DePaul University, 2018; Georgia Southwestern State University School of Education, 2012; Southern Arkansas University, 2018) to describe hands-on teaching experience and would also satisfy the current study’s definition of an internship.
Identity: I examined a number of identity factors, including the respondents’ sex, state residence, disability status, race, and sexual orientation. Sexual orientation and disability status are questions asked on the NSSE. I also examined respondents’ racial identity, residence, and sex, information provided by the UVM Office of Institutional Research.
Social capital: Social capital is defined by Bourdieu (1986) as resources linked to one’s network of relationships. In the current study, I operationalized social capital using NSSE’s Engagement Indicators: Student-Faculty Interaction, Quality of Interactions, Collaborative Learning, and Supportive Environment. Engagement Indicators are composites of questions that have better explanatory power and are detailed in the NSSE Data Codebooks (NSSE, 2018b).
Cultural capital: One’s intellectual skills and knowledge constitute cultural capital (Bourdieu, 1986). For the purpose of this study, I operationalized cultural capital with the respondent’s GPA and four NSSE engagement indicators that measure the student’s experience with higher order learning, reflective learning, learning and studying strategies, and quantitative reasoning.
Economic capital: Money, property, and other forms of economic wealth make up one’s economic capital (Bourdieu, 1986). I measured economic capital with the respondent’s first-generation status (information from UVM’s Office of Institutional Research) and the median household income in the respondent’s hometown. I obtained this number by cross-referencing the respondent’s hometown zip code with data from the U.S. census.
3.3. Overview and Research Design
This ex post facto quantitative study uses secondary analysis to examine two data sources: results from the 2017 National Survey of Student Engagement (NSSE) at the University of Vermont, and GPA and demographic information obtained through the University of Vermont’s Office of Institutional Research.
3.3.1. Research Questions
- Do students’ identities and/or economic, social, and cultural capital indicators differ depending on participation in an internship?
- What are the factors that significantly relate to undergraduate students’ participation in internships?
3.3.2. Hypotheses
This study tests the following hypotheses:
• Economic, social, and cultural capital indicators have a significant, positive relationship with students’ participation in an internship.
• Dominant identities (male, able-bodied, heterosexual, and White) have a significant positive relationship with participation in an internship.
• Students’ identities and economic, social, and cultural capital indicators significantly differ depending on whether the student participated in an internship or not.
3.3.3. NSSE as a Survey Instrument
According to the website for the National Survey of Student Engagement (NSSE), the NSSE measures first-year-student and senior students’ engagement at hundreds of four-year colleges and universities across the United States (2018a). NSSE defines student engagement as…
…two critical features of collegiate quality. The first is the amount of time and
effort students put into their studies and other educationally purposeful activities.
The second is how the institution deploys its resources and organizes the
curriculum and other learning opportunities to get students to participate in
activities that decades of research studies show are linked to student learning.
(NSSE, 2018a).
At the University of Vermont, the 2017 NSSE was administered to 527 senior students, which was a 24.7% response rate for the senior class. The NSSE survey used by the University of Vermont in 2017 contains a total of 109 multiple-choice responses organized into 40 sections.
The constructs within the NSSE survey tool have been shown to have high internal consistency as measured by a Cronbach’s alpha of over .70 for all subpopulations (NSSE, 2018c). NSSE constructions have also been shown to have acceptable levels of predictive validity, concurrent validity, and consequential validity, and are shown to have strong stability stable over repeated administrations (NSSE, 2018c).
NSSE questions that address self-perceived engagement mostly use four-point Likert scales. An example question is, “During the current school year, about how often have you done the following?” A sub-question is, “Discussed course topics ideas or concepts with a faculty member outside of class.” Answer options are: Very often; Often; Sometimes; Never.
Other questions ask about the student’s perceptions of the quality of their educational institution, the number of hours per week spent engaged in different activities, and questions about identity/demographics, e.g., mother’s highest level of education, status as a student-athlete, and sexual orientation.
3.4. Institutional Overview
The University of Vermont (known as UVM) is a public research institution located in Burlington, Vermont, in the United States (University of Vermont, 2018a). Established in 1791, the University is a Research 2 (R2) university, considered a “Public Ivy,” and ranked amongst the top 100 research universities in the country. In fall 2016, UVM accepted 69% of applicants to the institution (University of Vermont, 2017a).
In 2017 the University had a population of 10,513 undergraduates, 1,542 graduates, and 461 medical students (University of Vermont, 2018b). The University offers one hundred bachelor degree programs that fall into seven schools and colleges:
• College of Agriculture and Life Sciences
• College of Arts and Sciences
• Grossman School of Business
• College of Education and Social Services
• College of Engineering and Mathematical Sciences
• Rubenstein School of the Environment and Natural Resources
• College of Nursing and Health Sciences
UVM also has an Honors College for outstanding undergraduates (University of Vermont, 2018b). Students must receive an invitation to enroll in the Honors College, and then dually enroll in a “home college” and while also taking courses within the Honors College (UVM Honors College, 2018).
White students made up 81% of the undergraduate population at the University of Vermont in 2017 (University of Vermont, 2017b). Eleven percent of undergraduates identified as people of color, and 6% of undergraduates were international students in 2017.
The University of Vermont issued a white paper in 2013 entitled “Preparing for Life After UVM: A Career Success Action Plan” (Rizvi, 2013). Written by then-Honors College dean Abu Rizvi, the plan offered a comprehensive vision, strategy, and steps for increasing career preparation and development for UVM students. The Career Success Action Plan spurred the creation of five new career-focused positions (including my role as the internship coordinator in the Career Center), a centralized drop-in center focused on experiential learning (called “The Hub”), and a “Four Year Plan” to help students build necessary career experience during their four years in college (WGBH, 2014).
My position as the internship coordinator is located in the Career Center, a centralized office on campus that serves all undergraduate and graduate students (UVM Career Center, 2018a). There are several college-specific internship coordinators or career readiness professionals who are charged with serving their particular student populations. Those positions are situated within Arts and Sciences, Business, Engineering and Mathematical Sciences, and the School of the Environment and Natural Resources (UVM College of Arts and Sciences, 2018; UVM College of Engineering and Mathematical Sciences, 2018; UVM Grossman School of Business, 2018; UVM Rubenstein School of the Environment and Natural Resources, 2018). At the time of this writing, the College of Agriculture and Life Sciences, College of Education and Social Services, and College of Nursing and Health Sciences did not employ college-wide, dedicated career or internship professionals.
Most academic programs in UVM’s College of Nursing and Health Sciences and College of Education and Social Services require that students complete clinical or student teaching rotations for professional or licensure requirements (UVM College of Education and Social Services, 2018a; UVM College of Nursing and Health Sciences, 2018). Because UVM considers clinical and student teaching requirements as distinct from the internship experiences I examined for the current study’s research questions (UVM Office of the Provost, 2013), students in the Colleges of Nursing and Health Sciences and Education and Social Services were not included in the current study.
Internship and career readiness personnel at UVM provide resources and support to students during their internship searches, and students can speak with these staff members during designated drop-in hours or scheduled appointment times (UVM Career Center, 2018b; UVM College of Arts and Sciences, 2018; UVM College of Engineering and Mathematical Sciences, 2018; UVM Rubenstein School of the Environment and Natural Resources, 2018). UVM staff do not “place” students in internships, as is done at some other universities. They instead help students find and then apply to internship opportunities (UVM Career Center, 2018b; UVM College of Arts and Sciences, 2018; UVM College of Engineering and Mathematical Sciences, 2018; UVM Rubenstein School of the Environment and Natural Resources, 2018). The UVM Career Center maintains a job and internship database called Handshake, which lists opportunities at organizations all over the world, and students can use this tool to find and then apply to
internships.
3.5. Population and Sample
The unit of analysis for this study is seniors in the graduating class of 2017 at the University of Vermont. I excluded students in the College of Education and Social Services and College of Nursing and Health Sciences, as most majors in these colleges have degree requirements for clinical or teaching internship experiences (UVM College of Education and Social Services, 2018b; UVM College of Nursing and Health Sciences, 2018), and the current study seeks to understand elective internship engagement. In Chapter Four, Table 3 and Table 4 provide information on categorical and continuous demographic variables (respectively) for survey participants.
3.6. IRB Approval & Data Acquisition
To obtain permission to use data collected by NSSE and the UVM Office of Institutional Research (OIR), I completed an application for review by the University of Vermont Institutional Review Board (IRB) (Appendix A and Appendix B). Following approval by the IRB, I requested data from UVM OIR. OIR is charged with administering the NSSE survey as well as collecting and analyzing the NSSE results. Demographic and identity information such as sex, race, GPA, hometown zip code, and major are also recorded by the Office of Institutional Research. OIR offered to merge student demographic and identity institutional data with results from the NSSE for the purpose of this dissertation. After anonymizing student data using unique student identification codes, OIR kept the identification key and did not share it with me in order to protect participants’ identities. OIR provided me with the merged dataset in the form of a Microsoft Excel spreadsheet and an SPSS file, and I also obtained information of 2013-2017 median household income for each participant’s hometown zip code from the U.S. Census Bureau’s American FactFinder system (U.S. Census Bureau, 2017).
3.7. Data Preparation
I merged the dataset from OIR with the income data from the U.S. Census in an Excel spreadsheet and then opened the new merged dataset in IBM SPSS version 25 to prepare the dataset for analysis.
First, I reviewed all data to check for missing information or errors. I removed 208 cases missing the dependent variable (the answer to the NSSE item about participation in an internship) using listwise deletion (that is, removed all data for those cases) (Howell, 2008). I also removed 587 first year students from the data set, as my research questions focus on seniors.
As mentioned earlier, I removed students from UVM’s College and Nursing and Health Sciences and College of Education and Social Services from the dataset because these students often have internship requirements for graduation. When participation is mandatory, no predictions about elective participation can be made. Thus, I removed 83 cases from the dataset representing individuals who had membership in one of those two colleges. This left 350 cases for analysis.
For cases missing continuous independent variable data, I employed multiple imputation, which is an approach that uses educated guesses to address issues of standard error underestimation (Howell, 2008). Multiple imputation is a desirable alternative to listwise deletion, since listwise deletions may remove a large number of cases and reduce statistical power (Howell, 2008). Multiple imputation requires the imputation of multiple complete datasets, running analyses, and then combining those multiple analyses. The method uses imputed values based on the original dataset parameters and has become a statistical method of choice now that it can be conducted in SPSS Statistics software
(Howell, 2008). Forty cases in the dataset were missing continuous variable data, comprising 11.4% of the dataset. White, Royston, and Wood (2011) recommend using a number of imputations similar to the percentage of incomplete cases. Thus, I used 11 imputations.
While examining demographic information, I also decided to convert several demographic variables to binary variables instead of keeping all categorical options. For instance, when asked about their sexual orientation, respondents could choose from the following eight options: Straight (heterosexual); Bisexual; Gay; Lesbian; Queer; Questioning or unsure; Another sexual orientation, please specify (fill-in-the-blank); I prefer not to respond. Due to a small sample size, I made the decision to: combine Bisexual, Gay, Lesbian, Queer, Questioning or Unsure, and Another sexual orientation into a combined LGBQ category; create a category of students who identify as straight; and, leave a third category for those who did not wish to respond. I realize that this decision is not optimal, as it collapses all non-straight identities into a single category. Admittedly, I wrestled with this decision, as I place value on the respondents’ unique identities and want to see them all represented. That being said, I also wanted to ensure that those voices were all included in my statistical analysis. To keep all options would reduce the number of respondents in each variable so much that statistical analyses would no longer be meaningful. I also considered the fact that students from the minority/marginalized group (lesbian/gay/bisexual/queer/questioning/another sexual orientation) likely share some of the same college experiences with regard to their sexual orientation (Garvey, BrckaLorenz, Latopolski, & Hurtado, 2018).
I made the same decision for racial identity, collapsing all racial identities into two categories: People of Color and White. Again, I felt this decision was not an optimal way to measure the unique, lived experiences of people from different racial backgrounds. However, instead of losing the voices of a statistical few due to a small sample size in several racial identity categories, I decided to combine responses from People of Color into a single category based on the fact that they may have common college experiences as racial minorities at a Predominantly White Institution (PWI) (McCoy, 2014).
I used dummy coding for the following binary variables: residence (0 for out-ofstate, 1 for in-state); race (0 for White, 1 for Person of Color); sexual orientation (0 for straight, 1 for LGBQ or other); sex (0 for male, 1 for female); disability (0 for does not have a disability, 1 for has a disability); first-generation status (0 for not first-generation student, 1 for first-generation student); and, internship participation (0 for has not engaged in an internship, 1 for has engaged in an internship).
3.8. Procedure
I used Microsoft’s SPSS version 25 for all statistical procedures and began by examining the distribution of the dataset. I then executed analyses to answer my research questions. I conducted tests to compare means of the 16 identity and social/cultural/ economic capital indicators between interning and non-interning students. I then used four separate logistic regressions to examine the factors that significantly relate to undergraduate students’ participation in internships.
3.8.1. Outliers and Multicollinearity
Once the dataset was ready, I conducted preliminary analyses for outliers and multicollinearity. Outliers need to be examined and removed because the statistical analyses I used in this study assume a normal distribution of data. Outliers vary considerably from the distribution of the dataset, and are often due to errors in data collection (Howell, 2010). I found a normal distribution for my continuous variables, cumulative GPA and median household income.
Multicollinearity is the term for predictor variables that are highly correlated with one another (Howell, 2010). One method of measuring correlation is using Pearson’s Correlation Coefficient, which ranges from -1 (a strong negative relationship) to 1 (a strong positive relationship between variables) (Howell, 2010). A correlation of 0 indicates no relationship between items (Howell, 2010). Highly correlated items would have a correlation nearing -1 or 1, which would indicate multicollinearity. Having multicollinearity within my variables would be problematic, as one goal of my study was to discern the unique contribution that each variable has on internship participation. Pearson Correlation Coefficients of all independent variables are displayed in Table 2.
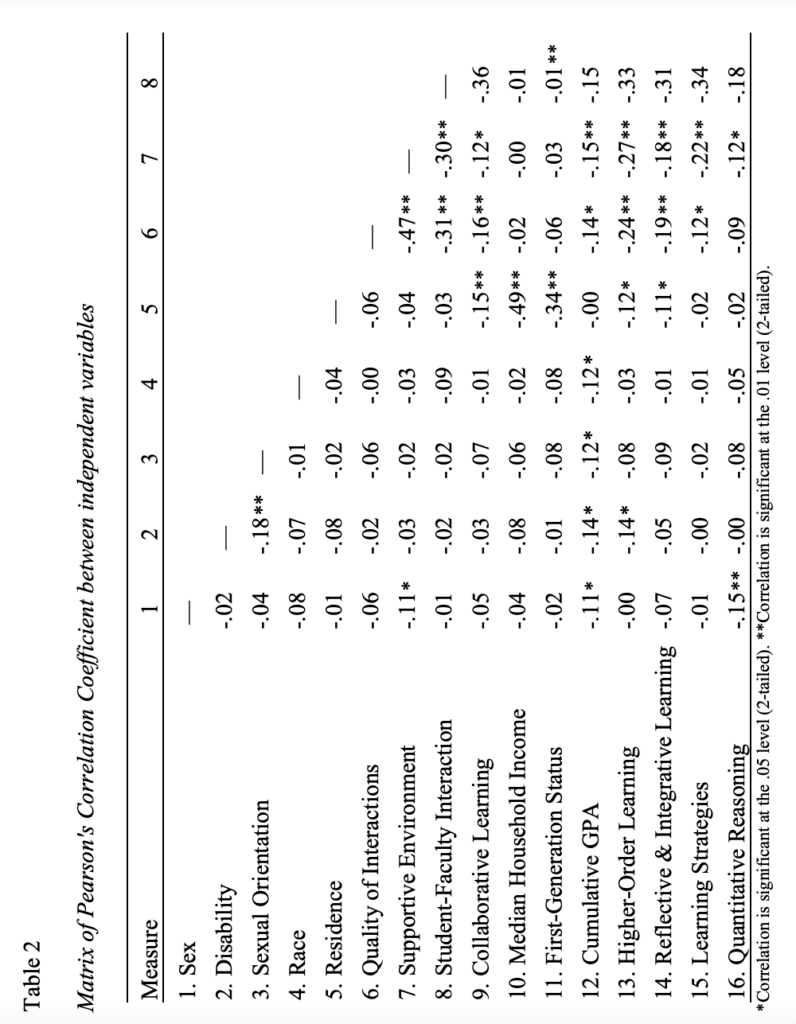
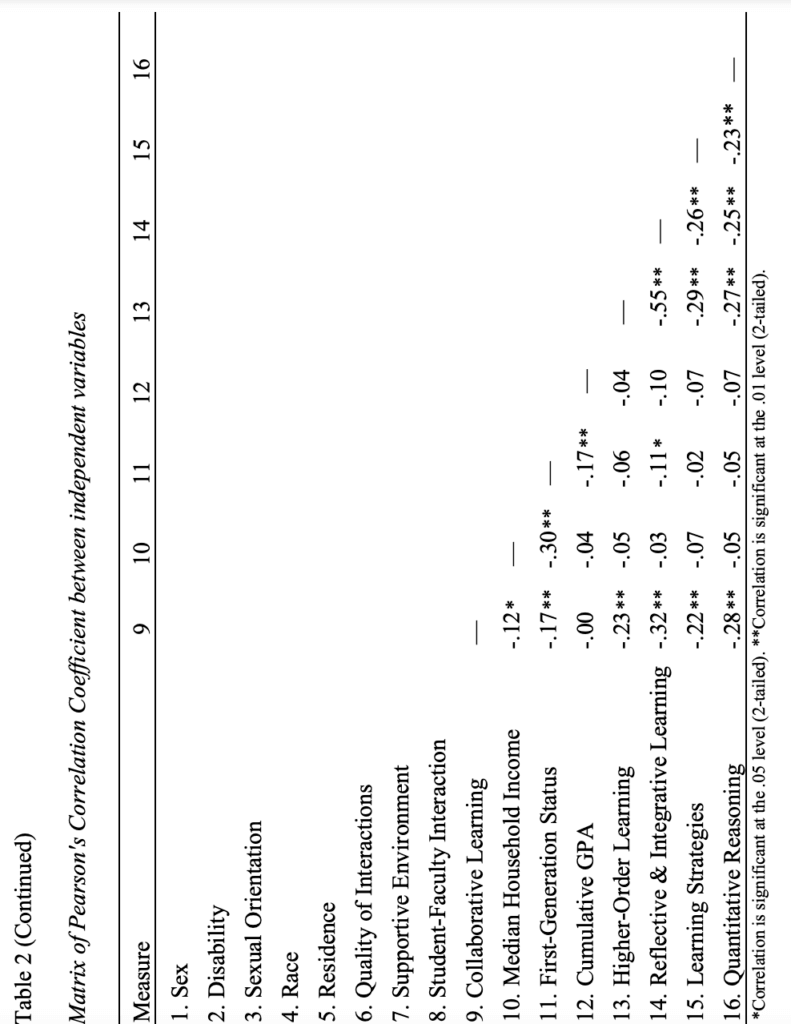
Only two independent variables had a moderate level of correlation (a Pearson Correlation Coefficient of over .50 or less than .-50), but none rose to the threshold of multicollinearity. Higher-Order Learning and Reflective and Integrative Learning were the most highly correlated factors with a Pearson Correlation Coefficient of -.55. HigherOrder Learning and Reflective and Integrative Learning are two NSSE engagement indictors categorized by NSSE under the theme of “Academic Challenge” (NSSE, 2019). A negative correlation between the two variables was somewhat surprising, but the variables were only moderately correlated. Since no other variables had a Pearson Correlation Coefficient higher than .5, I did not consider them highly correlated enough to be multicollinear. Thus, I noted correlations but kept all items in the dataset.
3.8.2. Comparing means with independent samples t-test and chi-square analysis
I initially ran descriptive statistics in SPSS to examine averages and distributions of the data. OIR grouped several NSSE questions using NSSE Data Codebooks, which combine individual question scores into larger composites (e.g., “Student-Faculty Interaction”) (NSSE, 2018b), which NSSE calls “engagement indicators” that have better explanatory power. I used eight of these engagement indicators in my analysis.
I then executed analyses to examine the differences in means between interning and non-interning students’ identities and social/cultural/economic capital indicators. I used an independent samples t-test for the ten continuous variables, which included GPA, median household income, and the eight NSSE Engagement Indicators I have identified: Student-Faculty Interaction; Quality of Interactions; Higher-Order Learning; Reflective & Integrative Learning; Learning Strategies; Collaborative Learning; Supportive Environment; and, Quantitative Reasoning. As a part of the t-test I also calculated Cohen’s d as a measure of effect size and to better understand the standardized difference between means (Cohen, 1988). Cohen’s d is calculated as the difference of each group’s mean divided by the average of their standard deviations.
I used chi-square analysis to investigate differences in categorical variables between the interning and non-interning groups. The six categorical variables were all binary, and included disability (has a disability/does not have a disability), sexual orientation (LGBQ/straight), race (White/person of color), sex (male/female), residence (Vermont/out-of-state), and first-generation (first-generation student/not first-generation student).
3.8.3. Regression Analysis
Since the variable of internship participation is dichotomous (seniors report that they have or have not participated in an internship), I used a binary logistic regression. Logistic regression is used to estimate the probability of an event occurring (Howell, 2010). In this case, I used logistic regression to determine if identity or social, cultural, or economic capital indicators predict internship engagement. I ran one logistic regression containing all 16 individual factors to examine the predictive power of specific independent variables. I also ran four separate regressions, each combining independent variables to understand the predictive power of larger themes. The four regressions had themes of identity (containing items sex, race, residence, disability, and sexual orientation), social capital (Quality of Interactions, Supportive Environment, Student-Faculty Interaction, and Collaborative Learning), economic capital (first-generation status and median household income), and cultural capital (Cumulative GPA, Higher-Order Learning, Reflective and Integrative Learning, Learning Strategies, and Quantitative Reasoning). See Table 1 in Chapter One.
3.7. Chapter Summary
In this chapter I presented the methodology for this quantitative ex-post-facto study, which examines the differences in identities and social, cultural, and economic capital held by those who participate in internships compared to those who do not. I used this methodology to explore my theoretical/conceptual model presented in Figure 1, detailing the identities and capital required to engage in an internship. Using Bourdieu’s (1986) capital theory, I built a framework hypothesizing that students of dominant identities (men, able-bodied, straight, and White students) with higher levels of social, economic, and cultural capital engage in internships at higher levels than their peers who have subordinate identities and/or lower levels of capital.
In Chapter Three I presented the purpose statement and defined and operationalized the study variables. I provided an overview of the research design, including research questions, hypotheses, and use of the NSSE as a survey instrument. I offered descriptions of the institution and population that I examined, as well as an overview of data preparation, research procedure, and data analysis.
— This is the fourth of six articles in this series. Click here to go to the next article. This series of articles are courtesy of Amanda Chase. Amanda Chase is the director of strategic engagement for the collective impact organization Advance Vermont, where she works to increase access to postsecondary education. She also has a private consulting business, and previously worked as the internship coordinator for the University of Vermont. Amanda has worked with a wide variety of businesses to support their hiring goals, from one-person grassroots organizations to Fortune 500 companies. Her hundreds of individual career counseling clients have included high school students applying to first jobs, adults making significant career transitions, retirees seeking encore careers, and everything in between. She received a bachelor of arts in psychology from Hamilton College, a master’s degree in counseling from the University of Vermont, and an Ed.D. in educational leadership and policy studies from the University of Vermont. Her work has always centered on issues of equity and access in education and career development. To learn more about Amanda or to get in touch, visit her website.

